HTML/CSS/Javascript in Firefox
This tutorial provides some tips for HTML/CSS/Javascript development using Mozilla Firefox. Topics covered include:
- viewing errors in your code
- printing debugging output from Javascript
- inspecting the HTML/CSS tree and editing it on-the-fly
- using a Javascript read-eval-print loop
- changing HTML/CSS properties programmatically
Installing Extensions
The FireBug and the Web Developer extensions for Firefox add many features excellent for debugging web applications. You need to install these extensions to follow the rest of the tutorial.
- Browse to the FireBug download site (opening new window).
- Click on the INSTALL FIREBUG button.
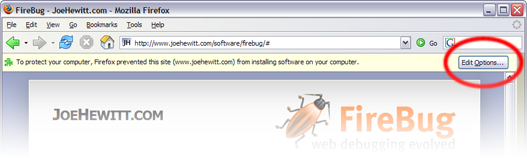
If this is your first time installing from this web site (which is most likely the case), Firefox will caution you about this action by putting up a yellow notification bar right above the page, saying, "To protect your computer...". If this happens, click on the Edit Options... button in that yellow bar as shown below. When the Allowed Sites - Software Installation dialog box shows up, click Allow and then close the dialog box. Then, click the INSTALL FIREBUG button again and go through with the installation.
- Similarly, browse to the Web Developer extension site (opening new window) and click on Install Now.
- Restart Firefox (this is necessary everytime you install any extension).
Find FireBug
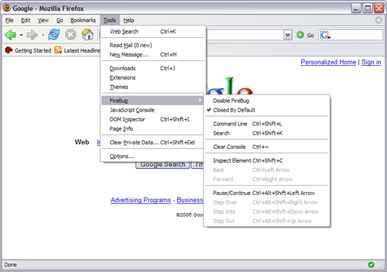
Start Firefox and take 5 seconds to
locate the Tools → FireBug menu (figure at right).
Also note FireBug status indicator in the status bar,
Viewing Errors
FireBug helps you view errors in your Javascript or CSS code. Browse to sample.html. (This page will appear in new window or new tab, so that you can switch back and forth between the sample page and this tutorial .)
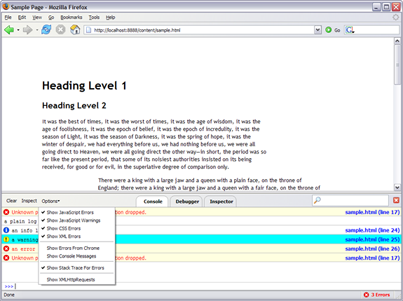
Then click on the FireBug status indicator (which should now say 1 Error). This opens up the FireBug pane at the bottom of FireFox:
You should see at least 5 lines in the FireBug console. If not, make sure you turn on the first four checkboxes in the Options menu (as shown at right) and reload the web page.
The first message in the console says Unknown property 'bogus-attribute'. Declaration dropped. At far right, FireBug indicates the offending line 17 in sample.html. Click on it. FireBug then switches over to its Debugger tab to show that the source code at that line.
Printing Your Own Debugging Output
FireBug also provides a way for you to print to its console using Javascript, which is useful for debugging. Go back to the FireBug Console pane, and look at the other messages. Click on the location for "an info log message". It will take you to the point in the code where the message was printed to the console, where you will see several examples of the methods of the console object you can call.
Be aware that console is available only when Firebug is installed; it's not part of standard Javascript. So don't leave console.log() calls in your code, or your page will break on browsers that don't have Firebug.
Viewing Source
There are many ways to get to the HTML source code of the page you're viewing. Try all of them.
- Click on FireFox's menu View → Page Source or press Ctrl-U (on Windows). Both of these actions open up Firefox's own source code viewer.
- Right-click on the page itself and choose View Page Source. Once again, this action opens up Firefox's own source code viewer. Note that the context menu also provides commands for viewing frames' source code.
- But of course, if this particular page you're seeing is served from your own computer, then simply open that file with a text editor.
Perhaps the best feature of Firefox's source code viewer is its Find feature. Open up Firefox's source code viewer (if you haven't already done so) and hit the forward slash / key to open up the Find toolbar at the bottom of the viewer's window. Then quickly type bogus and see that word highlighted in the code. Try to hit F3 to see if there are other occurrences.
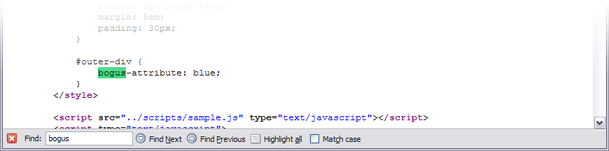
Note the Highlight all button, which can prove useful at times. The Find toolbar goes away after a while. This Find feature also works similarly on HTML pages in the main Firefox window.
Note the nested / hierarchical form of the HTML code. There is a hierarchy of nested HTML elements,
<html ...>
    <head>
        <title>...</title>
        ...
    </head>
    ...
</html>
or just elements for short. Each element has
- a starting tag, e.g., <title>,
- an ending tag, e.g., </title>,
- zero or more attributes, e.g., style="width: 40em", and
- possibly some text and inner elements.
Inspecting and Modifying the DOM
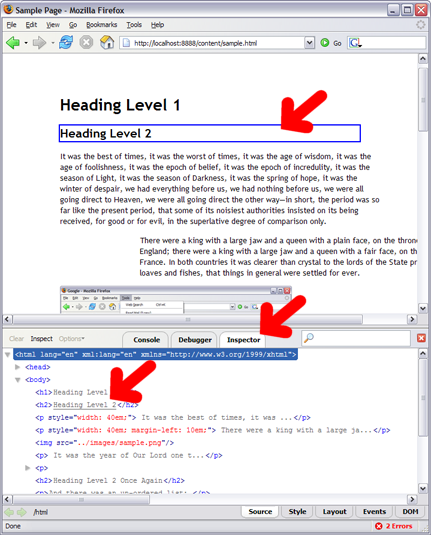
Return to Firefox and make sure that the FireBug pane is opened. Then switch over to its Inspector tab.
FireBug's Inspector shows the HTML source code you've looked at before, but now as a tree with expandable/collapsible nodes. Expand the body element and then hover your mouse over the h2 element. You should see that the corresponding header in the page is boxed in blue. Hover your mouse over various other elements and watch the blue box moves on the page.
This is what's going on: the Firefox browser (any browser, actually) parses the HTML code and constructs an in-memory representation of that code called a document object model, or a DOM for short. This same representation—the DOM—is used both by FireFox to render the page and by FireBug to render that expandable/collapsible tree. Here is the MVC design pattern at work—the same model is rendered quite differently by two different views.
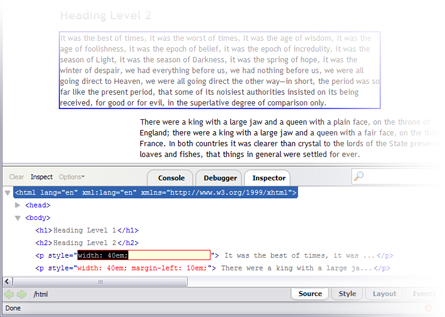
The DOM can be changed on-the-fly and such changes are reflected in the page's rendition. Locate the first p element in FireBug's Inspector (which corresponds to the first paragraph of text. Then click on the value of its style attribute and change that value to width: 20em;. Check that the paragraph in the page gets its width halved.
Of course, the change you just made didn't go back to that sample.html file on our web server. When you refresh the page, your change is gone.
But this ability to change the DOM on-the-fly and have those changes reflected in the page's rendition lets us make web pages much more interactive. It's what puts "dynamic" in "dynamic HTML" if you ever come across that buzzword.
Using FireBug's Javascript Prompt
FireBug has a read-eval-print loop for Javascript, that runs an expression in the environment of the current HTML page. Go back to the FireBug Console pane, and put the keyboard focus next to ">>>" at the bottom of the view. You can type any Javascript expression here to evaluate it and see its result in the console view. Try these expressions:
- 5+5
- console.log("hello, world")
- document.getElementById("inner-div")
The last expression above finds the HTML element whose id attribute is "inner-div". Note that FireBug displays it as a hyperlink that you can click on to jump directly to the HTML element in FireBug's Inspector.
Modifying the DOM Programmatically
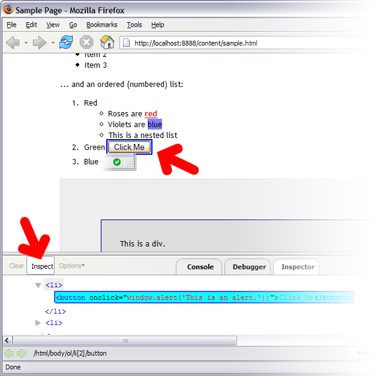
While the web page has focus, press Ctrl-F or / to activate the Find feature, and then type nested list. This should get you close to the Click Me button. Then click on the Inspector button in the FireBug pane and hover your mouse over the Click Me button on the page and click. This will locate the corresponding HTML element in the DOM tree shown in the FireBug pane.
Note that the button's onclick attribute says, window.alert('This is an alert');. Click on the Click Me button and see if that code makes sense—you should have gotten a dialog box saying, This is an alert.
Now, change that onclick attribute to: document.body.style.background = 'blue'; and then click on the button.
Of course, if you were to change the file sample.html in that way directly, the button would have caused the page's background to turn blue without you having to use FireBug to change the DOM at all.